
Getting Started with ELK Stack for Security Monitoring: A Practical Walkthrough
Setting up a Security Information and Event Management (SIEM) solution can often feel overwhelming due to the many components involved—Elastic, Logstash, Kibana, and more. Recently, I embarked on a journey to demystify this process, using free and accessible resources from John Strand’s anti-phishing training and Black Hills Information Security’s pay-what-you-can courses. In this blog post, I’ll share my step-by-step experience setting up the ELK stack (Elasticsearch, Logstash, Kibana) for security monitoring, including installing agents and configuring Sysmon logs to capture meaningful Windows event data.
Why ELK Stack for Security?
The ELK Stack is a powerful open-source platform for searching, analyzing, and visualizing log data in real time. When combined with Sysmon (System Monitor), it becomes a valuable tool for defenders to track malicious activity, understand attacker tradecraft, and build detection capabilities using the MITRE ATT&CK framework.
Step 1: Access Free ELK Labs and Training
Before diving into the setup, I want to highlight the fantastic resources that helped me along the way:
- John Strand’s Introductory Labs: Available freely on GitHub (search “strandJS intro labs”), these labs guide you through security tools and techniques.
- Black Hills Information Security's Pay-What-You-Can Training: These courses cover active defense, cyber deception, and more. You can register for free tuition assistance if needed, making this education accessible to everyone.
These resources provide written walkthroughs and labs that are beginner-friendly and well-documented.
Step 2: Creating Your ELK Deployment in Elastic Cloud
To get started quickly without complex local installs:
- Visit the Elastic Cloud website and sign up for a free 14-day trial (no credit card required).
- Fill out a simple form with your email and create a password.
- Create a new deployment (I named mine “Security Deployment”) using the default settings.
- After deployment creation, note the root credentials provided (they appear only once, so save them securely!).
The Elastic Cloud gives you access to Kibana for visualization, Elasticsearch for data storage, and Fleet for managing agents—all hosted in the cloud.
Step 3: Adding Elastic Agents with Fleet
Elastic Agents collect data from your endpoints and send it to your ELK deployment.
- Navigate to Fleet in Kibana under Security Management.
- Create a new agent policy or use the default.
- Click Add Agent, choose your host OS (e.g., Windows), and copy the enrollment command.
- Run this command in an elevated PowerShell terminal on your Windows machine.
This process downloads, installs, and enrolls the Elastic Agent as a service on your host, enabling real-time data collection.
Step 4: Installing and Configuring Sysmon
Windows logs alone can be noisy and not always useful for security monitoring. Sysmon enhances Windows event logging by capturing detailed process creation, network connections, and more.
- Download Sysmon from the official Sysinternals site.
- Extract the zip file and install Sysmon with the command:
sysmon64.exe -i
- Confirm that the Sysmon service is running by checking Windows services.
Step 5: Configuring Fleet to Collect Sysmon Logs
Back in Kibana:
- Open your agent policy in Fleet.
- Add the Windows integration.
- Enable the Sysmon module within the integration.
- Save and deploy the changes.
With this configuration, Elastic Agents will collect enhanced Sysmon logs and send them to your ELK deployment for analysis.
Step 6: Generating and Viewing Logs in Kibana
To verify data collection:
- Perform some activities on the Windows host like opening applications (Calculator, WordPad), browsing, or running commands.
- In Kibana, go to the Discover dashboard.
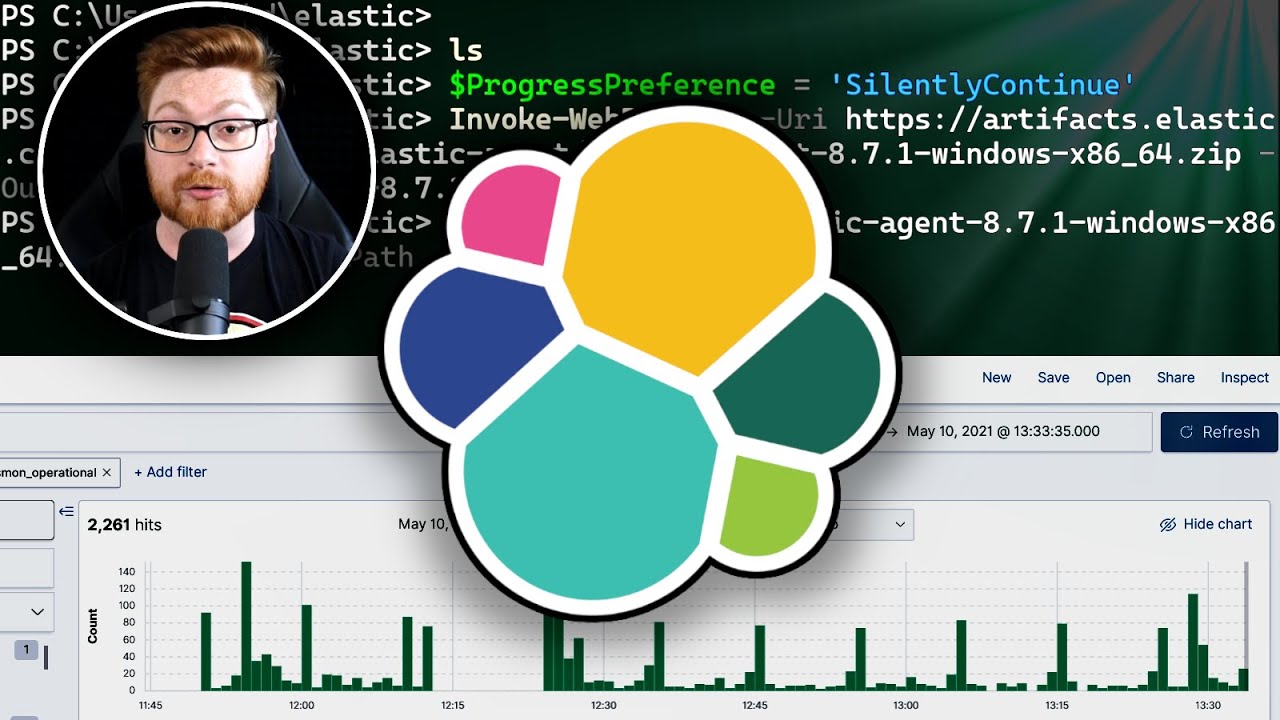
- Select the
logsdata view and apply filters forwindows.sysmon_operationallogs. - Search for event ID 1 (process creation) to see detailed logs of process starts with command lines and timestamps.
This visibility allows you to track what processes are running on your endpoints and when, providing valuable information for threat detection.
Why This Matters
This hands-on experience with ELK Stack and Sysmon shows how defenders can build their own SIEM to monitor endpoint activity effectively. The ability to ingest, search, and visualize security logs is crucial for understanding attacks and improving organizational defenses.
Final Thoughts and Resources
If you’re interested in diving deeper into security monitoring and defense, I highly recommend:
- Exploring Black Hills Information Security’s Training
- Taking advantage of John Strand’s Free Labs
- Experimenting with ELK Stack in Elastic Cloud to build your own SIEM workflows
This journey not only made ELK approachable but also provided tactical knowledge applicable in real-world security operations.
Thanks for reading! If you found this helpful, consider subscribing to stay updated with more practical infosec guides.
About the Author
A passionate information security enthusiast dedicated to making complex security tools accessible through hands-on tutorials and clear explanations. Follow for more cybersecurity insights and tutorials.
Happy hunting and stay secure!